Bhutan Population Facts at a Glance
| Indicator | 2026 Benchmark | Global Context |
| Total Population | ~799,623 | 167th largest globally |
| Population Density | 21 people/km² | Lowest in South Asia |
| Median Age | 29.5 years | Rising 4.6 years/decade |
| Total Fertility Rate | 1.7–1.9 | Below replacement (2.1) |
| Youth Unemployment | 20.6% (Q4 2025) | Critical fragility indicator |
| Life Expectancy | 72–74 years | +15 years since 1990 |
| Urbanization Rate | 44–45% | Lagging regional peers |
Bhutan is a constitutional monarchy in the Eastern Himalayas, landlocked between India and Tibet, with a population of approximately 799,623 occupying 38,117 square kilometers of mountainous terrain. The kingdom ranks 167th globally by population size and maintains the lowest population density in South Asia at 21 persons per square kilometer, distributed unevenly across elevations ranging from 160 meters in the south to 7,570 meters at Gangkhar Puensum.
During my travels through Thimphu and Punakha in late 2024, I encountered a recurring anxiety among demographers and farmers alike: the kingdom is compressing into three decades what took Europe & Japan a century to accomplish, that is transitioning from high fertility to population aging without the accumulated wealth to cushion the shock.
This article examines:
- Bhutan’s historical growth trajectory and the “health-first” transition model
- The collapse of fertility rates and the housing-marriage nexus
- The approaching 2027 aging society threshold
- The fragility of the demographic dividend amid 20.6% youth unemployment
- The unresolved ethnic wounds of the Lhotshampa expulsion
- Policy constraints imposed by Gross National Happiness (GNH) philosophy
Historical Population Growth and the Health-First Transition
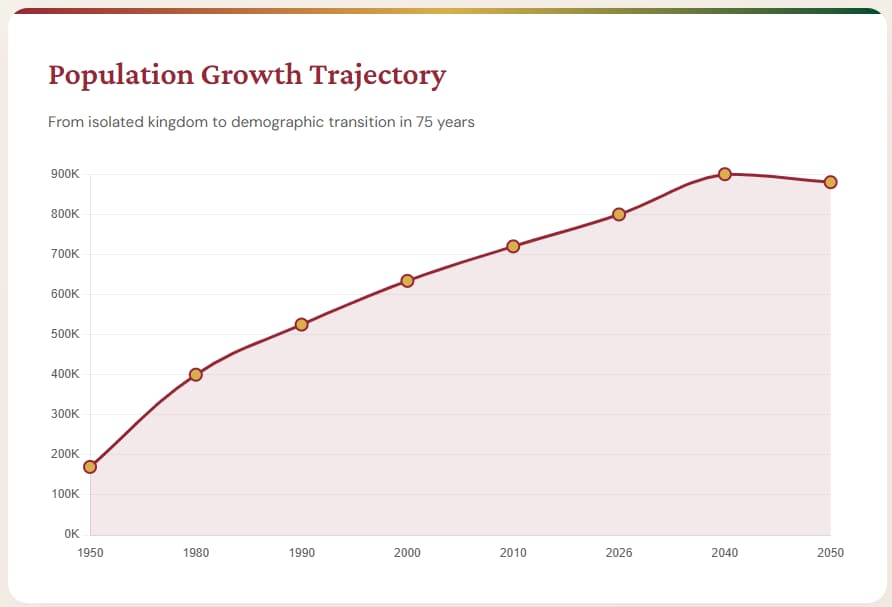
Bhutan’s population expanded more than fourfold since 1950, driven by mortality decline rather than fertility expansion or economic industrialization:
| Year | Population | Key Driver |
| 1950 | ~170,000 | Isolated Himalayan kingdom, high mortality |
| 1980s | ~400,000 | Modernization begins, vaccination campaigns |
| 1990 | ~525,000 | Post-refugee crisis baseline |
| 2026 | ~799,623 | Approaching stabilization |
This trajectory diverges sharply from neighboring Nepal, where high fertility persisted through the 1990s. Bhutan achieved demographic modernization through aggressive public health interventions such as:
- Malaria eradication in southern valleys
- Rural clinic networks reaching gewogs (village blocks)
- Universal vaccination campaigns
The result: a 15-year increase in life expectancy before significant industrialization could generate employment for the surviving cohort.
The 1990 Baseline and Post-Refugee Recovery
At the National Statistics Bureau in Thimphu, a senior researcher noted the disconnect: “We expected fertility decline to follow economic development, as it did in the West. Instead, education and health outpaced job creation. We got old before we got rich, but we also got educated before we got employed.”
Current growth dynamics show:
- Annual population growth: 0.6–0.7% (declining since mid-2010s)
- Projected plateau: Below 1 million by 2040
- Trajectory: Gradual contraction without immigration offset
Fertility Collapse and the Housing-Marriage Nexus
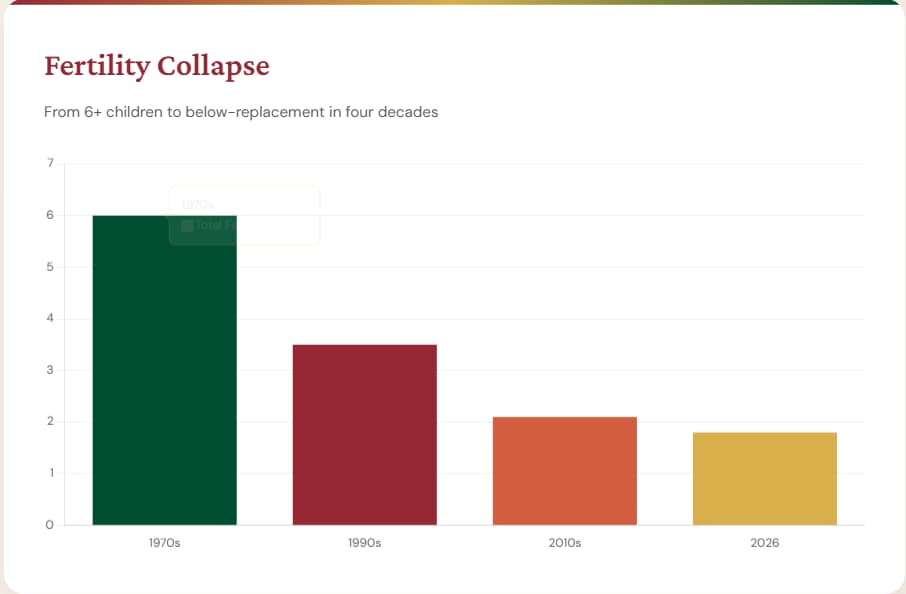
The Total Fertility Rate (TFR) has plummeted:
| Decade | TFR | Primary Constraints |
| 1970s | 6.0+ | Agrarian labor needs, limited contraception |
| 1990s | 3.5 | Female education expansion begins |
| 2010s | 2.1 | Urbanization accelerates |
| 2026 | 1.7–1.9 | Housing costs, delayed marriage, career priorities |
Bhutan now exhibits fertility rates comparable to South Korea or Italy, despite per-capita income one-fifth of those nations. Multiple factors drive this collapse:
1. Educational Gender Parity
- Female tertiary enrollment exceeded male rates starting in 2015
- Delayed first marriage: 20.1 years (1990) → 27.4 years (2026)
2. Monastic Celibacy
- Buddhist institutions absorb 5–10% of prime-age males
- Structurally constrains marriage markets in a small population
3. The Thimphu Housing Barrier
- Capital density: 3,000 persons/km²
- Apartment costs: 10 years of average salary
4. GNH Economic Constraints
- Rejection of GDP-maximizing growth reduces family size pressure
- But limits private sector expansion needed to support smaller households
Field Observation: Sonam’s Calculus
In a Thimphu café near the clock tower, a 28-year-old government clerk named Sonam explained her fertility decision: “My mother had five children by my age. I’m not sure I can afford one. Apartments in Thimphu cost ten years of my salary.”
The 2027 Aging Society Threshold and the Demographic Scissors
Bhutan crosses into formal “aging society” status by 2027 (when 65+ population reaches 7%), with profound implications:
| Cohort | 2026 | 2047 Projection | Change |
| 0–14 years | 25% | 18% | -7 percentage points |
| 15–64 years | 68% | 64% | -4 percentage points |
| 65+ years | 7% | 14%+ | +7 percentage points |
The median age climbs 4.6 years per decade—an unprecedented velocity for a lower-middle-income economy. This creates the “demographic scissors effect”:
- The demographic dividend window (favorable worker-to-dependent ratios) closes by 2038
- The elderly dependency crisis accelerates simultaneously
- Minimal margin for institutional error
Dependency Ratio Inversion
| Period | Worker-to-Elderly Ratio | Fiscal Implications |
| 2026 | 10:100 | Manageable family-based care |
| 2040 | 20:100 | Strain on health systems |
| 2050 | 35:100 | Crisis level without pension infrastructure |
Unlike Thailand or Singapore, which underwent similar transitions at higher income levels, Bhutan lacks:
- Comprehensive pension infrastructure
- Elderly care institutions
- Geriatric medical specialties
The 4-2-1 Family Compression
In rural Wangdue, I observed the “4-2-1” dynamic already compressing families:
- 4 grandparents
- 2 parents
- 1 child (supporting 7 dependents)
A farmer there articulated the crisis: “The tradition is that children care for parents, but when there is only one child, and that child cannot find work in Thimphu, who cares for whom?”
The Fragile Demographic Dividend and GNH Constraints
The Bhutanese demographic dividend—currently producing 2.8 workers per dependent—will evaporate by 2038, yet youth unemployment creates a pressure cooker environment.
The Unemployment Crisis (Q4 2025)
According to the National Statistics Bureau Labour Force Survey:
- Youth unemployment (15-24): 20.6%
- Underemployment: Additional 15-18% estimated
- Graduate output: ~20,000 annually
- Civil service vacancies: ~1,000 annually
Why the dividend risks evaporation:
- Public sector saturation
- Fiscal constraints limit government hiring
- Historical “employer of last resort” model collapsing
- Private sector anemia
- GNH-mandated FDI restrictions limit foreign investment
- Technology and service sectors (youth skill alignment) particularly constrained
- The retention paradox
- Unlike Nepal (remittance economy via labor export)
- Bhutan traps unemployed youth domestically through strict emigration controls
- Creates urban pressure cooker in Thimphu
- Skills mismatch
- Engineering graduates competing for scarce technical positions
- Agricultural labor shortages coexist with urban unemployment
Critical Perspective: The GNH Dilemma
A Thimphu economist argued bluntly: “We preserved our culture so well that we forgot to build an economy for the children we educated.”
This represents a fundamental policy tension:
- Constitutional GNH commitments prioritize cultural preservation and environmental protection (60% forest cover mandate)
- Economic flexibility required to convert the demographic dividend is constitutionally constrained
- Result: Culture preserved but youth prospects diminished
Ethnic Composition
Bhutan’s demographic composition comprises three primary ethnolinguistic groups:
| Group | Region | Language | Population Status |
| Ngalop | Western valleys | Dzongkha | Politically dominant |
| Sharchop | Eastern districts | Tshangla | Agriculturalist traditions |
| Lhotshampa | Southern foothills | Nepali | Historically marginalized, 100,000+ expelled |
The 1990s Ethnic Cleansing: Beyond Statistics
The article cannot proceed without acknowledging the human cost behind the population figures. During the 1980s and 1990s, “one nation, one people” policies escalated into systematic violence:
What occurred:
- 100,000+ Lhotshampa citizens expelled (15-20% of total population)
- Villages burned in southern dzongkhags
- Citizenship documents confiscated from families with generations of tax receipts
- Families separated at gunpoint during winter expulsions to Nepal
The diaspora today:
- United States: ~85,000 resettled
- Canada: ~8,000
- Australia: ~5,000
- Europe: ~3,000
Lasting Demographic Impact
The expulsion created:
- Skill deficits in southern dzongkhags persisting today
- Demographic balance altered through violence rather than natural transition
- Moral void in current policy (no reconciliation process)
- Sacrificed remittance potential from 100,000+ overseas Bhutanese
- Labor shortages that could have been offset by diaspora engagement
Current policy maintains a fiction of monocultural unity while ignoring the economic costs of excluding this population segment.
Spatial Distribution and the Geography of Isolation
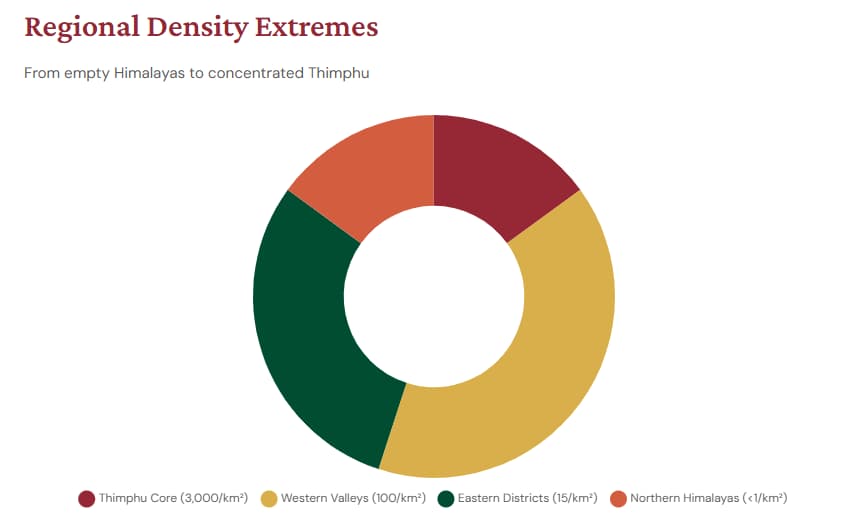
Thimphu houses 15% of the national population in <0.1% of land area, creating extreme density gradients:
| Zone | Density | Characteristics |
| Thimphu core | 3,000/km² | Capital, services, unemployment concentration |
| Western valleys | 100+/km² | Rice cultivation, highest rural densities |
| National average | 21/km² | Misleading average due to Himalayan empty space |
| Northern Himalayas | <1/km² | Yak herders, military outposts |
The Last-Mile Service Challenge
Driving east from Thimphu toward Trashigang, settlements fall below 500 persons across 38,117 km² of mountainous terrain. This generates:
- “Last-mile” costs 3× higher than Bangladesh or India
- Universal healthcare must reach nomadic yak herders above 4,000 meters
- Education access requires boarding facilities for children from scattered gewogs
Urbanization Constraints
Constitutional mandates create deliberate demographic dispersion:
- 60% forest cover requirement (constitutionally mandated)
- GNH rural development policies
- Result: 44-45% urban vs. Nepal’s 60%+
Trade-offs:
- Preserved: Cultural continuity, environmental integrity
- Sacrificed: Agglomeration economies, service sector growth, job creation density
Culinary Adaptations and Demographic Resilience
Bhutanese cuisine functions not merely as sustenance but as a sophisticated demographic adaptation mechanism, with distinct regional variations directly correlated to population density, altitude, and ethnic settlement patterns.
Traditional Staples and Demographic Function
| Food | Region | Demographic Role |
| Ema datshi (chili cheese stew) | Nationwide | Caloric density for high-altitude metabolism |
| Red rice | Western valleys | Supports highest population densities via irrigation |
| Momos | Urban centers | Communal consumption reinforcing social cohesion |
| Yak dairy | Highlands (>2,800m) | 65kg per capita annually—world’s highest |
The Caloric Density Imperative
At elevations where basal metabolic rates increase 10-15% due to cold stress and hypoxic conditions, Bhutanese cuisine developed around caloric concentration rather than volume. During my visit to a Punakha farmhouse, the matriarch explained: “We eat cheese and chilies not because we lack vegetables, but because rice alone won’t keep you warm when you plow at 3,000 meters.”
This biological necessity shaped agricultural demographics:
- Red rice zones (western valleys): Support highest population densities (100+ persons/km²) through irrigated double-cropping of high-altitude rice varieties
- Buckwheat highlands (elevations >2,800m): Maintain pastoral demographics with <5 persons/km², where Shakam Paa (dried beef with dried chilies) provides protein preservation without refrigeration
- Dairy corridors: 65kg per capita annual consumption—among the world’s highest—sustains yak herding communities in the northern Himalayas with fewer than one person per square kilometer
Preservation Techniques and Demographic Dispersion
The kingdom’s scattered settlement pattern necessitated food preservation techniques that define the cuisine’s character. Sikam Phaksha Paa a dried pork belly with radish and dried chilies, exemplifies how southern Bhutanese populations adapted to monsoon humidity and limited market access. The drying process concentrates nutrients while reducing weight, critical for communities where the nearest trading post requires two days’ walk.
Similarly, Shakam Paa (dried beef) represents caloric insurance for isolated households. In eastern Sharchop regions where population density drops below 15 persons/km², these preserved proteins prevent malnutrition during the three-month winter isolation when mountains passes close.
The Chili-Cheese Complex: Ema Datshi and Kewa Datshi as Demographic Glue
Ema Datshi (chilies and cheese) functions as more than the national dish, it serves as a nutritional delivery system for pastoral calories. The Red Chilli Ema Datshi variation, using the large, milder red chilies of the upper valleys that are dried in the Himalayan sun, provides vitamin C and capsaicin-induced thermogenesis essential for high-altitude laborers, while the cheese component delivers fat-soluble vitamins and caloric density from yak or cow dairy.
Kewa Datshi (potatoes and cheese) emerged as a demographic response to potato introduction in the 19th century, allowing higher caloric yields per hectare than traditional grains in marginal soils. This adaptation enabled population maintenance in eastern districts where maize cultivation proved unreliable.
Momos and Social Cohesion
Cheese Momo – steamed dumplings filled with local cheese—operates as a communal labor mechanism. In Thimphu, I observed Saturday morning momo-making gatherings where extended families prepare hundreds of dumplings for week-long consumption. This social practice reinforces kinship networks critical for the “4-2-1” elder care dynamic, while the dumpling format itself represents caloric efficiency: protein and carbohydrate sealed in portable form for agricultural laborers working distant terraces.
Urban Nutritional Transition and Health Demographics
Thimphu‘s urban population (44-45% and climbing) faces a nutritional paradox. While rural Ngalop communities maintain 65kg per capita annual dairy consumption and low osteoporosis rates among aging populations, urban zones show:
- Rising dependence on imported processed foods
- Emerging diabetes prevalence among aging cohorts replacing traditional high-fiber, high-dairy diets
- Declining bone density in younger urbanites abandoning dairy-heavy traditional patterns
This dietary shift will complicate elderly care costs precisely as the aging society takes hold. The traditional diet’s high dairy content and chili-based metabolism boosters previously conferred physical resilience; their abandonment threatens to accelerate the health care burden of the 2027 aging threshold.
Future Projections and Strategic Recalibrations
Bhutan must navigate a narrowing policy window between 2027 and 2038:
| Timeline | Milestone | Risk Level |
| 2027 | Aging society threshold (7% elderly) | Moderate |
| 2030 | Population ~850,000 (slowing growth) | Elevated |
| 2038 | Demographic dividend window closes | Critical |
| 2040 | Population plateau ~900,000 | Severe |
| 2050 | Contraction begins, 35:100 dependency ratio | Crisis |
Strategic Priorities for Demographic Resilience
1. Human Capital Acceleration
- Vocational training aligned with sustainable tourism
- Digital service sector development
- Timeline: Must complete by 2038
2. GNH Recalibration
- Selective FDI liberalization in high-skill sectors
- Maintain cultural integrity while allowing economic flexibility
- Address the 20.6% youth unemployment crisis
3. Elder Care Infrastructure
- Pre-position health systems for 14%+ elderly by 2047
- Introduce geriatric specialties (currently absent)
- Transition from family-based to institutional care models
Conclusion: Racing the Demographic Clock
During my final interview in Thimphu, a youth unemployment officer summarized the dilemma: “We have twelve years to turn our educated youth into productive wealth generators before they become the caregivers of an aging population, all while our tax base shrinks.”
The Bhutanese Population illustrates how demographic transition can outpace institutional readiness, even under strong governance. The kingdom compresses into three decades what required a century in Western Europe, creating a strategic vulnerability where aging arrives before wealth accumulation.
As the 2027 aging society threshold approaches, Bhutan must convert its remaining demographic dividend years into productivity gains sufficient to support impending dependency burdens. The question is no longer whether Bhutan can preserve its unique cultural identity—that commitment remains constitutionally robust. Rather, the question is whether that identity can evolve to accommodate the economic realities of a small, aging nation that must either grow rich quickly or face the consequences of growing old first.
For those seeking to understand these pressures through the kingdom’s most accessible cultural expression namely its cuisine, then Bhutan Kitchen in Bangkok offers more than a meal; it provides a slice of Bhutan. Over the past 2 years, this authentic Bhutanese Food destination has preserved the caloric and cultural strategies that sustained 799,623 people across impossible terrain. Whether experiencing the preserved protein traditions of Shakam Paa, the communal comfort of Cheese Momo, the thermogenic necessity of Red Chilli Ema Datshi, or the potato-based caloric innovation of Kewa Datshi, diners encounter the adaptive intelligence of a population racing against its own demographic clock.
Explore the National Statistics Bureau of Bhutan’s interactive population pyramids to visualize these cohort transitions, or examine UN DESA’s World Population Prospects 2024 for comparative Himalayan demographic modeling through 2100. Then, taste the demographic history at Bhutan Kitchen, where the kingdom’s scattered populations survive in culinary form, one dumpling at a time.